Metrics and dashboards
Sourcegraph ships with Grafana for dashboards, Prometheus for metrics and alerting. We also provide built-in alerting for these metrics.
Grafana
Site admins can view the Grafana monitoring dashboards on a Sourcegraph instance:
- Go to User menu > Site admin.
- Open the Monitoring page from the link in the left sidebar. The URL is
https://sourcegraph.example.com/-/debug/grafana/.
Dashboards
A complete dashboard reference is available for more context on our available service dashboards and panels.
Additional dashboards can also be set up - see Grafana configuration for more details.
View documentation
On service dashboards, each metric panel has links attached that lead to relevant alert solutions or panel documentation. These can be accessed from the top left corner of each panel.
View alerts
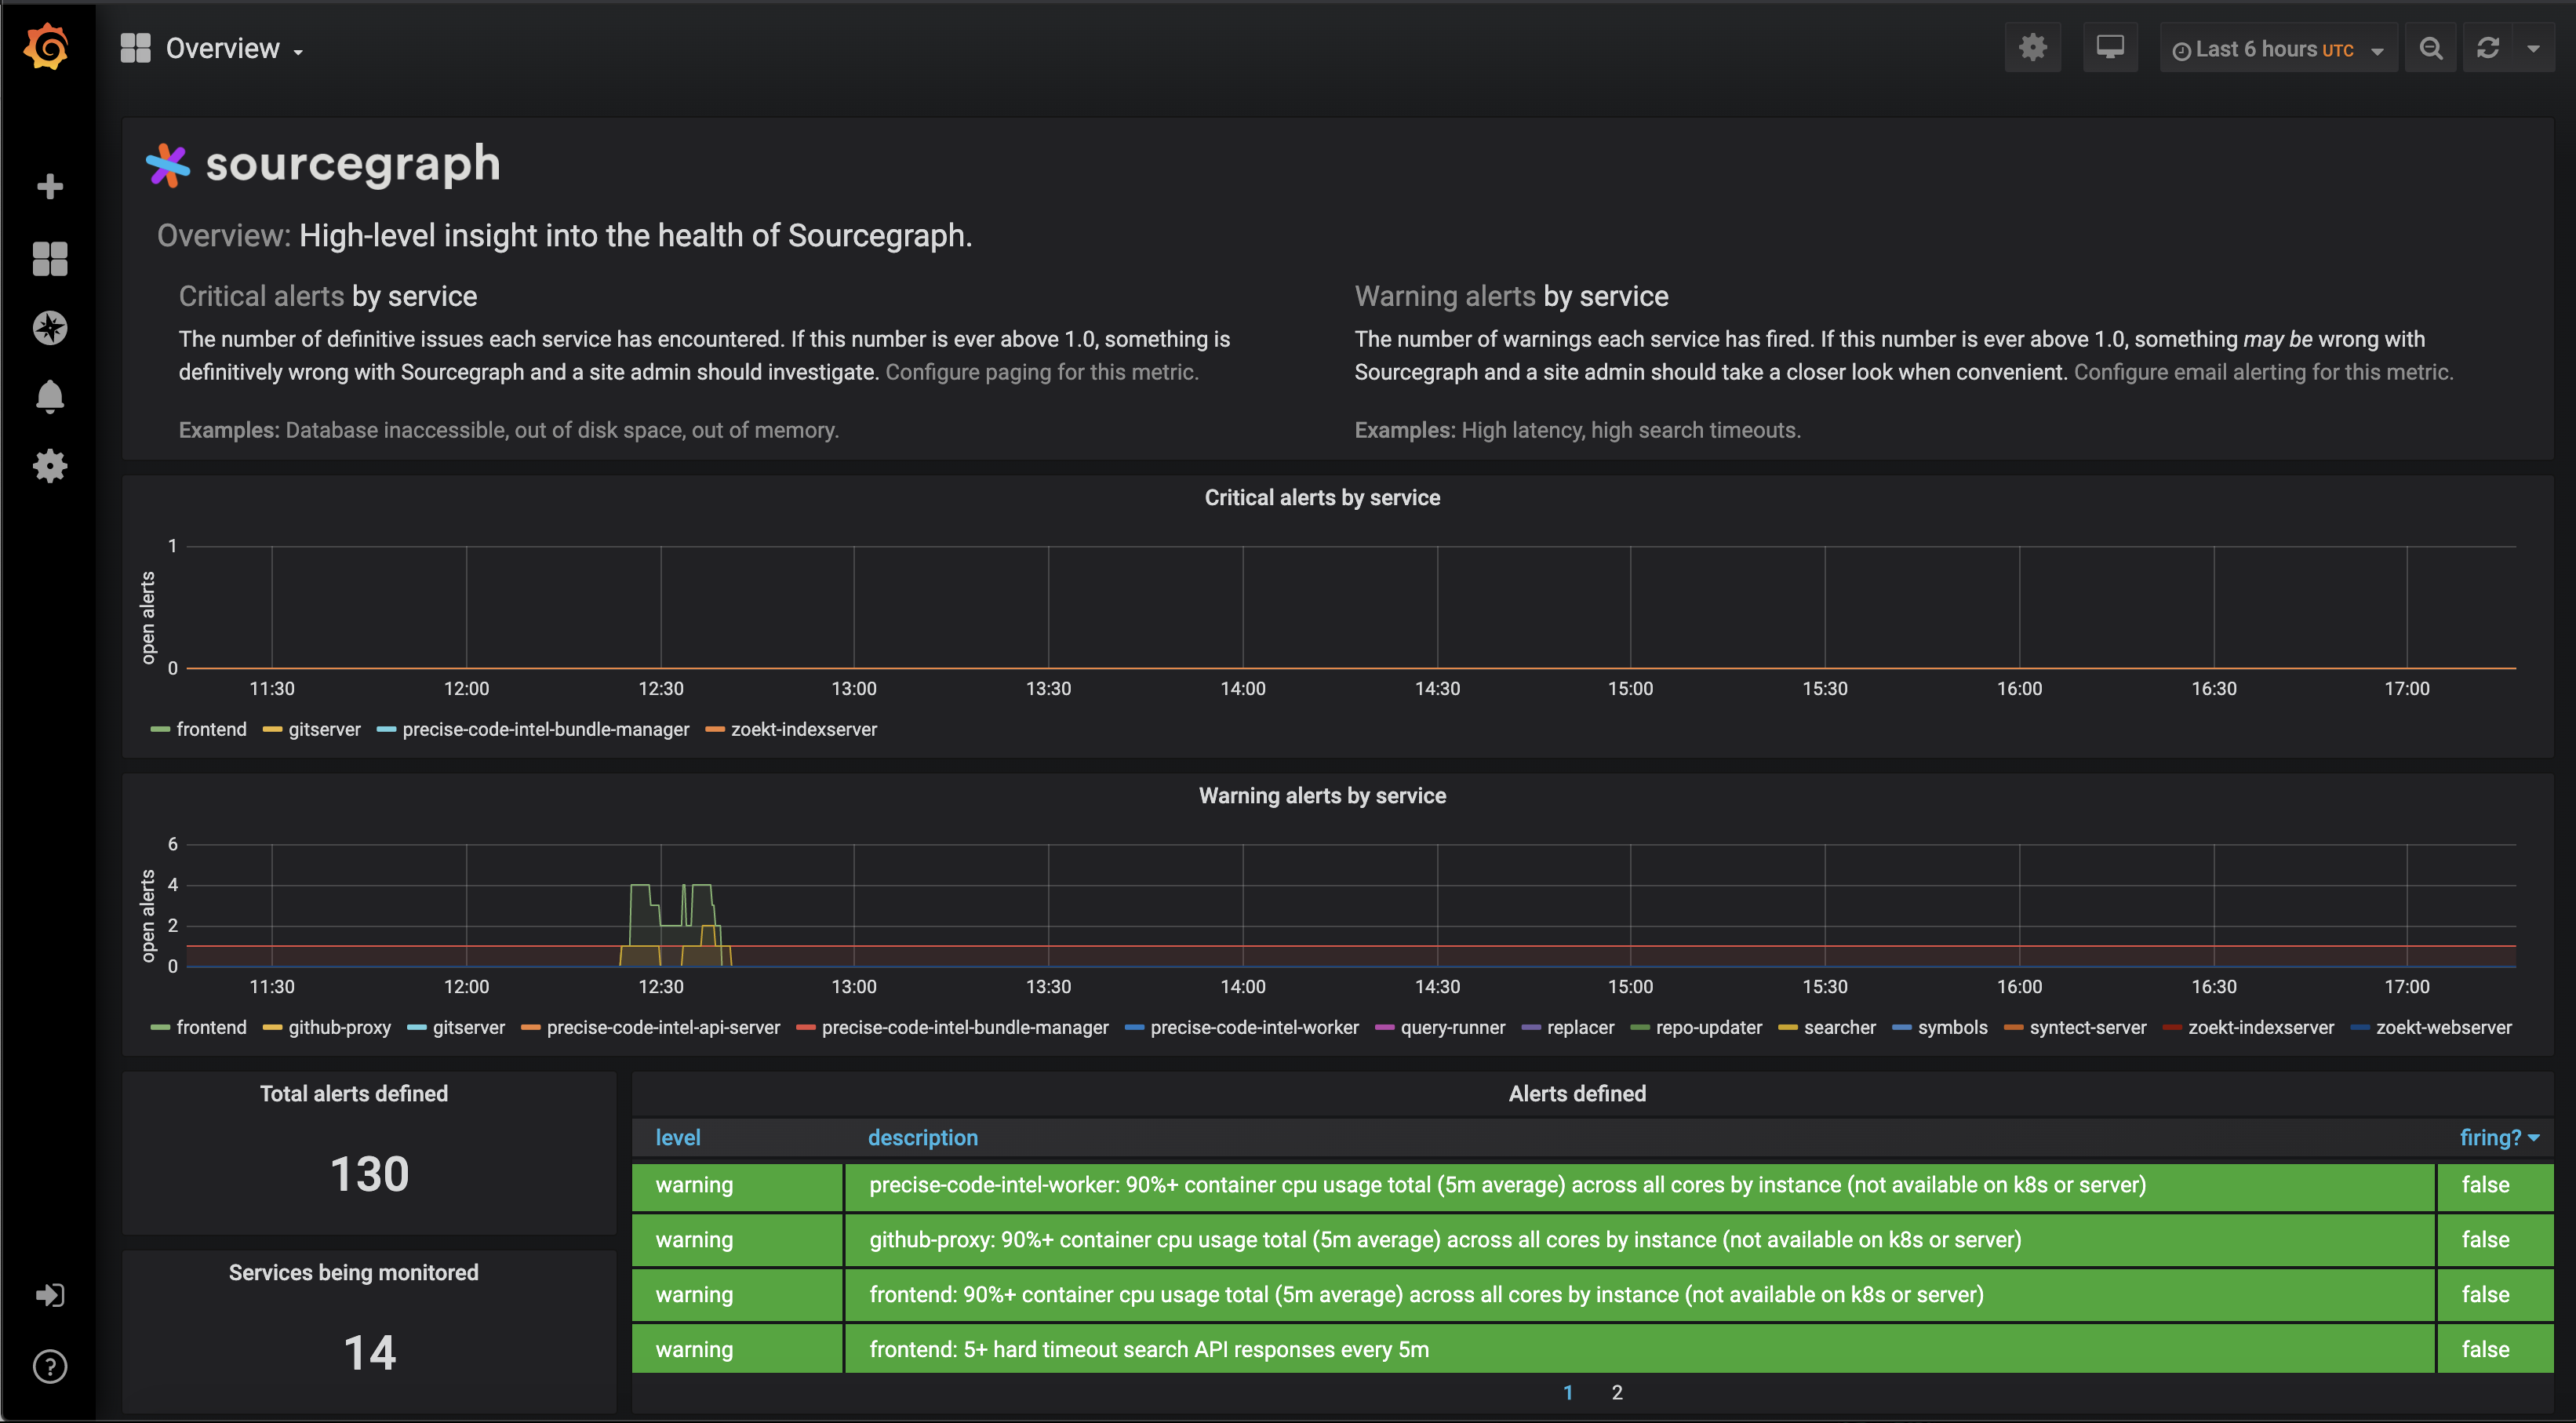
The Overview dashboard includes a high-level summary of alert events across all Sourcegraph services.
On service dashboards, a summary of alert events for that service is available. Alerts can be filtered by level using the "Filter alert level" selector at the top of the dashboard. This information can be overlaid on all panels in that dashboard by enabling the "Alert events" toggle.
View version change events
On service dashboards, annotations can be displayed for occasions when a Sourcegraph version change is detected by enabling the "Version changes" toggle at the top of the dashboard. This can be useful for correlating metrics and alerts with Sourcegraph deployment and upgrade events.
Querying metrics
Specific metrics can be queried using Grafana's Explore panel, available at /-/debug/grafana/explore on your Sourcegraph instance.
The query for each individual panel can be viewed and explored by clicking on the panel and using the "Explore" option.
Grafana configuration
Sourcegraph deploys a customized image of Grafana, which ships with Sourcegraph-specific dashboard definitions.
To provide custom dashboards, a directory containing dashboard JSON specifications can be mounted in the Docker container at /sg_grafana_additional_dashboards.
Changes to files in that directory will be detected automatically while Grafana is running.
More behavior can be controlled with environmental variables.
Accessing Grafana directly
For most use cases, you can access Grafana through your Sourcegraph instance. Follow the instructions below to access Grafana directly to, for example, edit configuration directly.
If you are using the Kubernetes deployment option, you can access Grafana directly using Kubernetes port forwarding to your local machine:
kubectl port-forward svc/grafana 3370:30070
Grafana will be available http://localhost:3370/-/debug/grafana.
If you are using Docker or the docker-compose deployment option, Grafana is available locally at http://localhost:3370/-/debug/grafana without any additional setup.
If Sourcegraph is deployed to a remote server, then access via an SSH tunnel using a tool such as sshuttle is required to establish a secure connection to Grafana.
To access the remote server using sshuttle from your local machine:
sshuttle -r user@host 0/0
Grafana will be available at http://host:3370/-/debug/grafana.
Prometheus
Prometheus is a monitoring tool that collects application- and system-level metrics over time and makes these accessible through a robust query language.
For most use cases, you can query Prometheus through Grafana using Grafana's Explore panel, available at /-/debug/grafana/explore on your Sourcegraph instance, or simply rely on the dashboards we ship.
Available metrics
High-level alerting metrics
Sourcegraph's metrics include a single high-level metric alert_count which indicates the number of level=critical and level=warning alerts each service has fired over time for each Sourcegraph service.
This is the same metric presented on the Overview Grafana dashboard.
Description: The number of alerts each service has fired for a given alert name and severity level.
Values: Although the values of alert_count are floating-point numbers, only their whole numbers have meaning.
For example, 0.5 and 0.7 indicate no alerts are firing, while 1.2 indicates exactly one alert is firing and 3.0 indicates exactly three alerts firing.
Labels:
| Label | Description |
|---|---|
service_name |
the name of the service that fired the alert |
name |
the name of the alert that the service fired |
level |
either critical or warning, as defined here |
description |
a human-readable description of the alert |
Complete reference
A complete reference of Sourcegraph's vast set of Prometheus metrics is not yet available. If you are interested in this, please reach out by filing an issue or contacting us at [email protected].
Prometheus configuration
Sourcegraph runs a customized image of Prometheus, which packages a standard Prometheus installation together with rules files and target files tailored to Sourcegraph and quality-of-life integrations such as the ability to configure alerting from the Sourcegraph web application.
A directory can be mounted at /sg_prometheus_add_ons. It can contain additional config files of two types:
- rule files which must have the suffix
_rules.ymlin their filename (iegitserver_rules.yml) - target files which must have the suffix
_targets.ymlin their filename (ielocal_targets.yml)
Rule files and target files must use the latest Prometheus 2.x syntax.
The environment variable PROMETHEUS_ADDITIONAL_FLAGS can be used to pass on additional flags to the prometheus executable running in the container.
Accessing Prometheus directly
Most of the time, Sourcegraph site admins will monitor and query key metrics through Grafana, rather than through Prometheus directly. Grafana also provides the dashboards that monitor the standard metrics that indicate the health of the instance. Follow the instructions below to access Prometheus directly instead.
If you are using the Kubernetes deployment option, port-forward the Prometheus service:
kubectl port-forward svc/prometheus 9090:30090
If you are using Docker or the docker-compose deployment option, you will need to restart the Sourcegraph container
with a flag --publish 9090:9090 in the docker run command.
Prometheus will be available http://localhost:9090.
Using a custom monitoring system
Please refer to our FAQ item, "Can I consume Sourcegraph's metrics in my own monitoring system (Datadog, New Relic, etc.)".