Code Insights frontend architecture overview
Table of contents
- Insights directory structure
- Insight types
- Insight configuration storing
- Quick intro to the setting cascade
- Insight consumers
- Code Insights loading logic in details
Insights directory structure
We store all insights related parts of components and logic in the insights directory.
The full path to this folder is ./client/web/src/enterprise/insights. There you can find all components
and code insights shared logic.
This directory has the following structure
/components- all shared and reusable components for code insights pages and others components./core- backend-related logic such asInsightsApiContextand data fetchers. Also, analytics and core interfaces for code insights entities./hooks- all shared across insights components hook-based logic./mocks- mock collections for unit tests and storybook stories./pages- all pages-like code insights components (such asDashboardPageorInsightCreationPage)/sections- Enterprise version of insights grid components that are rendered at the homepage and the directory page./utils- common helpersInsightsRouter.tsx- The main entry point for all code-insights pages.
Note: that some part of insights logic is stored in ./client/web/src/insights
analytics.ts- analytics logic to get insights setting cascade related metrics (such as code insights count)types.ts- code insights related types for top-level component props.utils- utils functionality such as code insights experimental flags checkers.
Insight types
At the moment, we have two different types of insights.
- Built-in (former Extension based) insights.
These types of insights fetch data via frontend insight fetcher function. That means that we make a few network request to our search API to collect and process insight data on the frontend (source). At some point, we used Extension API to get information about these insights. You still can find these extensions by links below but they currently are not used for insight data fetching.
At the moment we use the main-tread built-in insight fetchers source
- Backend based insights.
These insights are working via our graphql API only. At the moment, only search based insights (line chart) can be backend-based. Code stats insights (pie chart) only work via extension API.
You can find typescript types that describe these insight entities in core/types/insights/index.ts
Insight configuration storing
To be able to fetch data for an insight, we need to store some insight configuration (input data), such as data series config—line color, search query string, the title of data series.
We use the setting cascade to store these insight configurations. For example, Search based insight configuration looks something like this
{
  // other setting cascade subject properties
  // ...
  // ...

  "searchInsight.insight.someInsight": {
    "title": "Some insight",
    "repositories": ["github.com/test/test", "github.com/sourcegraph/sourcegraph"],
    "series": [
      { "title": "#1 data series", "query": "test", "stroke": "#000" },
      { "title": "#2 data series", "query": "test2", "stroke": "red" }
    ]
  }
}
Backend based insights also have their insight configurations, and they are also stored
in the same settings cascade but by special property key insights.allrepos
{
  // other setting cascade subject properties
  // ...
  // ...

  "insights.allrepos": {

    "searchInsight.insight.someInsight": {
      "title": "Some insight",
      "series": [
        {
          "title": "#1 data series",
          "query": "test",
          "stroke": "#000"
        }
      ]
    }
  }
}
You can find typescript types that describe these insight entities in core/types/insights/index.ts
This way to store insights isn't the best, but this is the easiest way to get insight configs from extensions. Eventually, we want to migrate all insights to our BE and store them in real DB. At the moment we already have moved our extension based insight to the main app.
We also can write to these jsonc files and therefore create or delete some insights. This is actually how it works
on the creation UI. After submitting, we just produce a valid insight configuration, write this config to the setting subject jsonc file,
and upload this new config back via GQL API.
Important note: Each insight (search backend or built-in based or code stats insight) has the visibility setting.

This setting is responsible for storing the insight in some particular setting subject file (personal, org level, or global jsonc file)
For example, if I created insight with some particular organization, the logic behind the creation page will load
jsonc file of organization subject then add newly created insight (its configuration) to this jsonc file
and then saves it via our gql API and trigger re-hydration for local settings, so you don't need to reload the page
to see the last updated settings cascade on the page.
Also, this setting affects what dashboard will be used to show this insight.
It is worth mentioning that we use setting cascade subjects not only for storing insight configurations but also dashboard configurations. We will cover this in other sections further.
Quick intro to the setting cascade
As we mentioned before all insights (their configurations) are stored in the setting cascade. But what is the setting cascade?
In a nutshell, this is just a system around a couple of configuration files (called subjects). These files
are just jsonc files. But each subject (jsonc) file has its cascade level (means that setting cascade has some file hierarchy)
So eventually, the FE merges all these files in one big jsonc object and deserializes this object to a common js object.
You can find this merge logic here client/shared/src/settings/settings.ts
mergeSettings function.
We use settings cascade a lot in different places, In fact, our dashboard system and insight visibility were built on top of settings cascade levels.
Insight consumers
The first thing we should know before diving deep into the code insights codebase are the places where we're rendering/showing code insights component.
At the moment, we have at least three different places where you can find code insights components/logic
- The dashboard page
- The dashboard page itself
- Creation UI pages (search and code stats insights)
- The Home (search) page
- The directory page
Further, we will cover all three places where we use something from the insights code-base.
The dashboard page
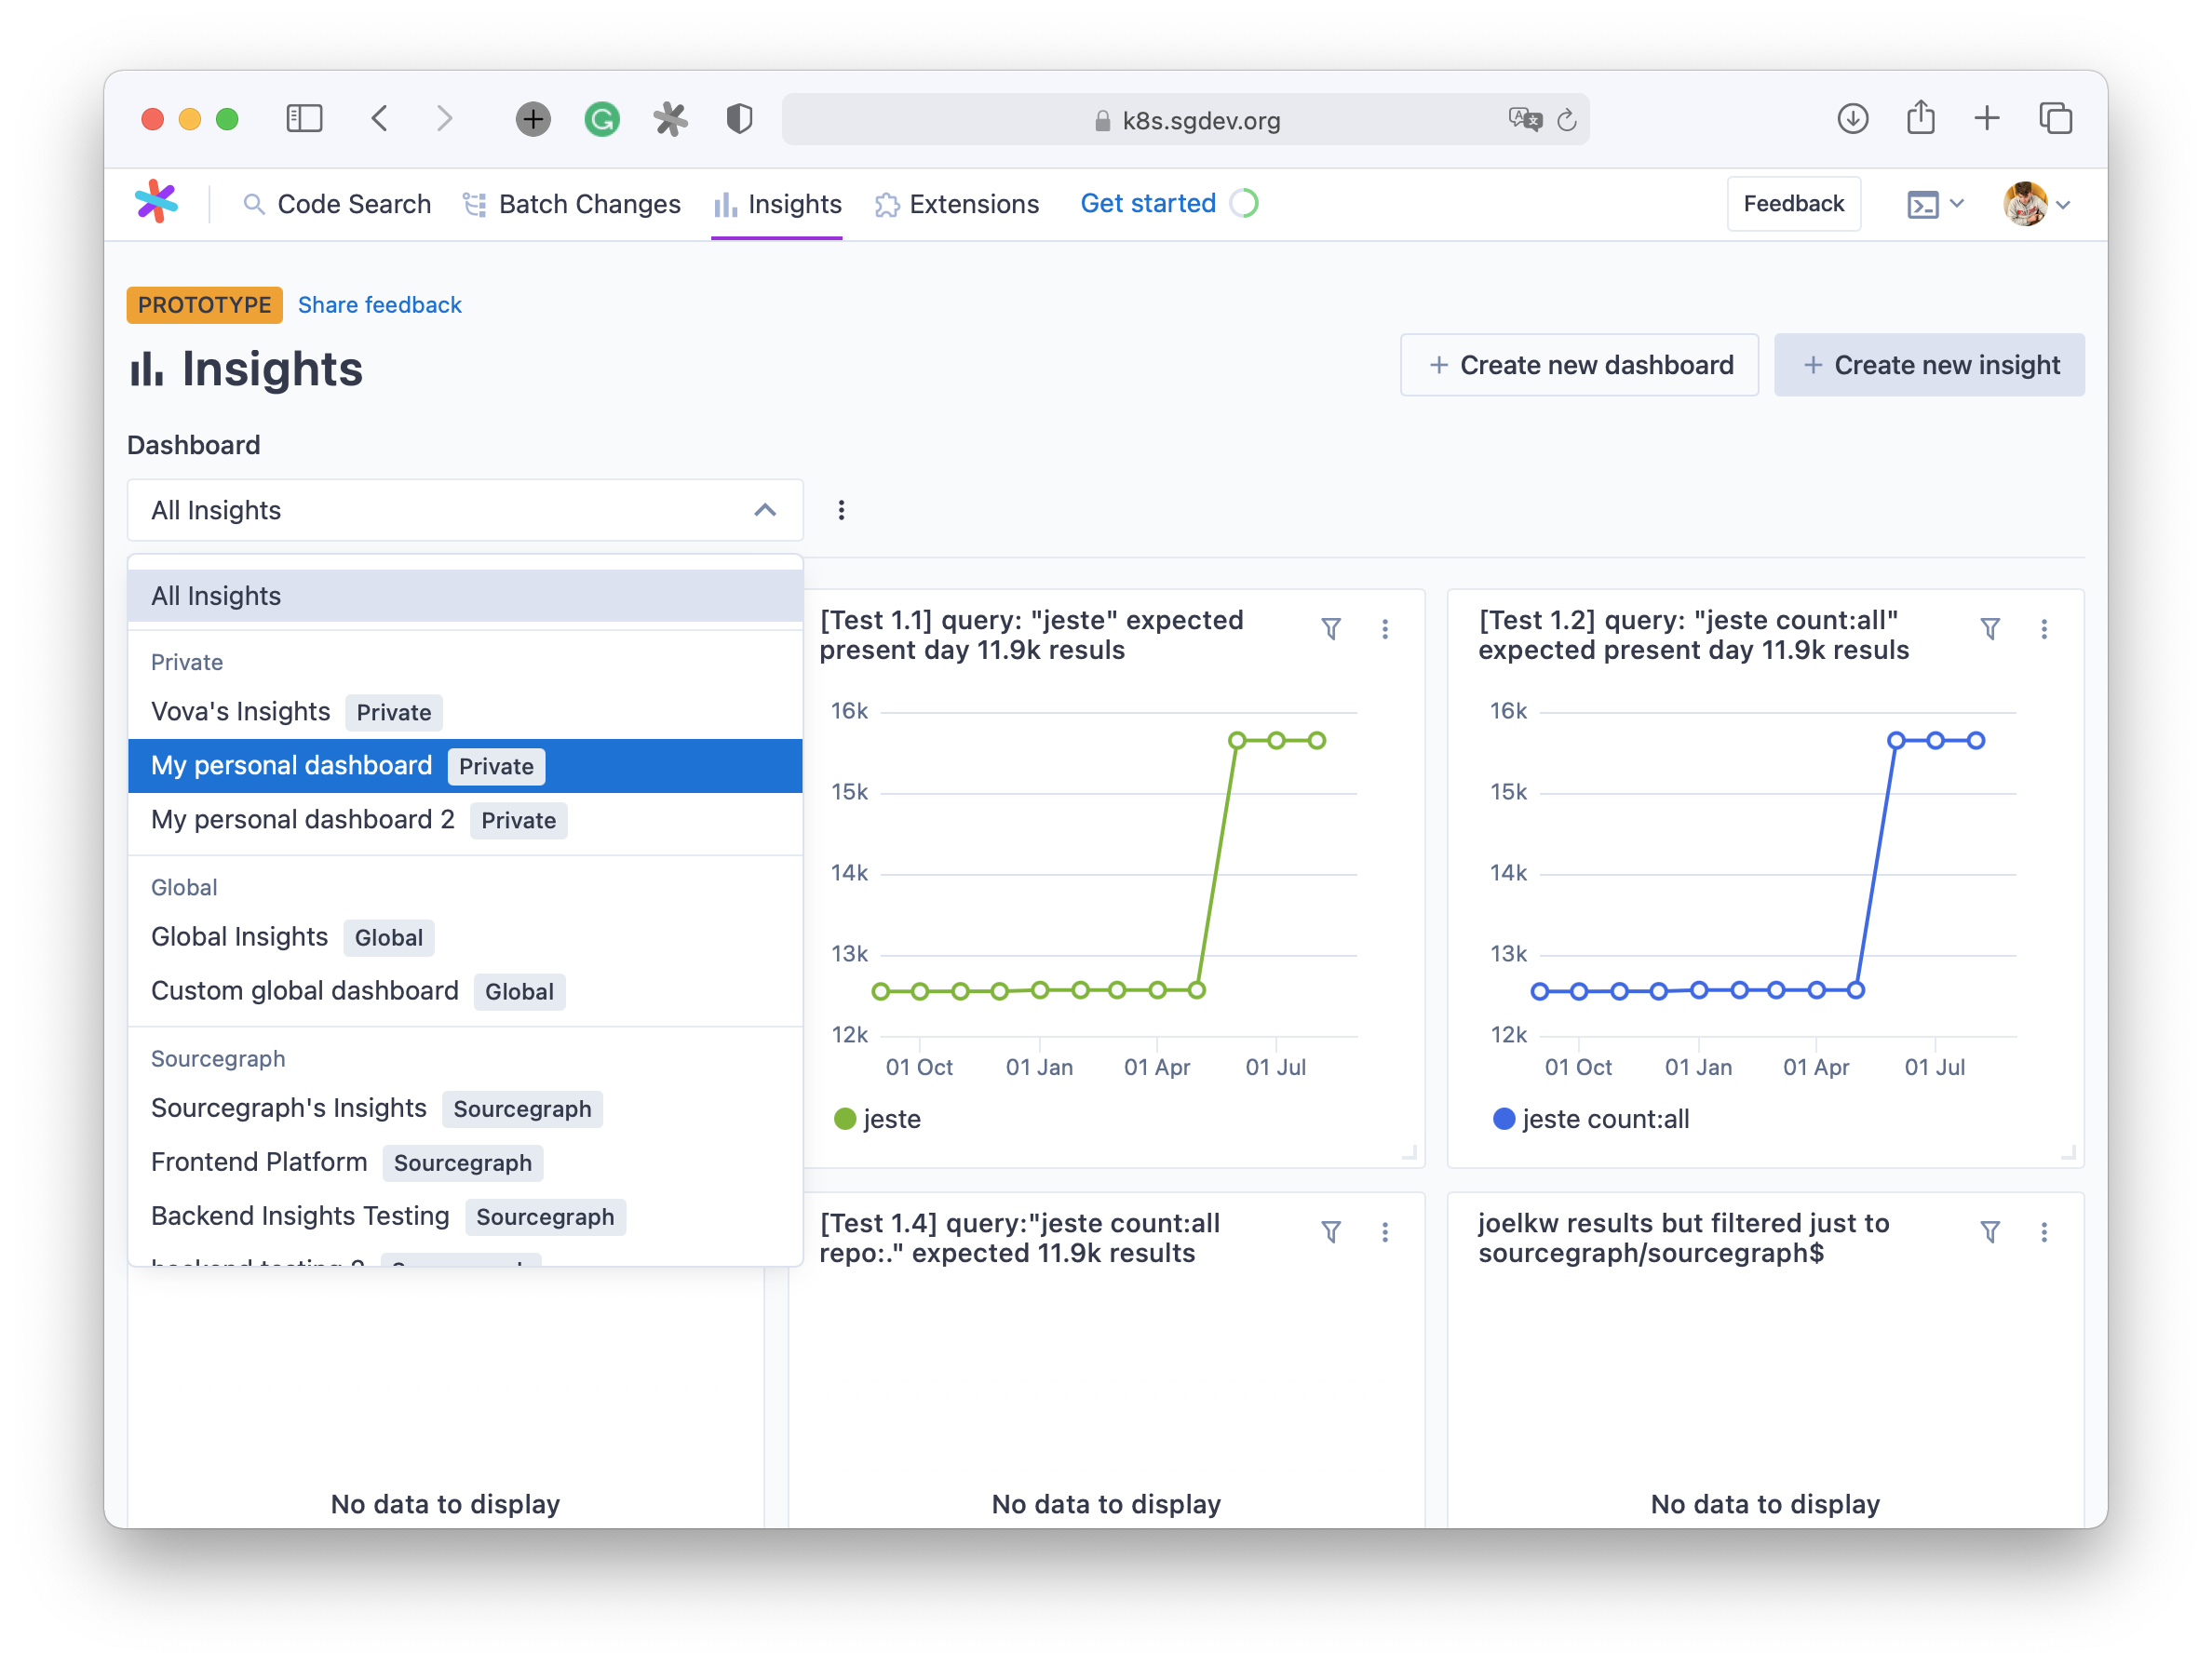
This page is kind of the main source of insights in the app at the moment. By the dashboard page, you can find any accessible to you insights by going through different dashboards.
As you can see on the screenshot above, the page has the select component to pick the right dashboard.
All dashboards have the following hierarchy
- All insights dashboard
This dashboard contains all available user insights from all places. All users have this dashboard by default, users can't delete this dashboard. - < user name >'s insights
This is something called a built-in dashboard. This dashboard represents your personal level of settings, which means that this dashboard contains all insights from your personal setting cascade subjectjsoncfile and only these insights. This dashboard also can't be deleted. - < organization name >'s insights
This is also a built-in dashboard. It has the same functionality as a personal dashboard but contains insights only from this org level jsonc setting subject file. - Global insights
Also, built-in dashboard. This dashboard contains insights from the subject of the global setting, which is shared across all users within single sourcegraph instance. You should be an admin to be able to write and update this setting subject.
All three types of dashboards (user, organizations, and global) can have their custom dashboards via dashboard creation UI.
So this fact leads us that we need to store dashboard configuration somewhere. To be able to filter some insight and leave only those insights which were added/included to some particular dashboard.
We use setting cascade subject to store dashboard configurations.
Example of this dashboard config:
{

  "insights.dashboards": {
    "myPersonalDashboard": {
      "id": "2e20a79f-d32d-4433-b367-c0874d391e78",
      "title": "My personal dashboard",
      "insightIds": [
        "searchInsights.insight.allReposInsightTesting",
        "searchInsights.insight.stringTestForNamesFelix"
      ]
    },
    "myPersonalDashboard2": {
      "id": "4d609411-1586-48e9-8ed4-ecac80aff11f",
      "title": "My personal dashboard 2",
      "insightIds": [
        "searchInsights.insight.test13QueryJesteRepoExpectedPresentDay119KResuls"
      ]
    }
    // Other dashboard configs
  }
}
You can find dashboard typescript types for these dashboard properties in core/types/dashboard/index.ts
Let's take a look at the dashboard system in action. For example, let's describe what will happen when we go to the /insights/dashboard/<personal subject id>
- We extract the dashboard id from the URL in the
DashboardPagecomponent via react-router URL options. - With the
useDashboardhook) we select/extract all reachable dashboards from all settings cascade levels. - Then we map the dashboard id from the URL and all dashboard configs, extract information about dashboard
like insights ids (
insightIdsproperty) - Pass
insightsIdinformation to component for rendering insights (in case of the dashboard page this component isSmartInsightsViewGrid.tsx(source)) SmartInsightsViewGrid.tsxcomponent will iterate over allinsightIdsget insight configuration from setting cascade byuseInsight()(source) hook and pick the right component (eitherBackendInsight.tsx(source) orBuiltInInsight.tsx(source)- Then this backend or built-in insight component will load insight data either by GQL API in the case of Backend Insight or by few FE network search API requests in case of Built-In insight.
Code Insights loading logic (InsightsApiContext)
All async operation which is related to fetching data or calling something from the extension API is produced and provided via
React Context system. Code Insights API is accessible via InsightAPIContextsource
This was done in this way to mock and change the implementation of async (backend API or extension API) calls in unit tests.
Let's take a look on simple version of BuiltInInsight component
function BuiltInInsight(props) {
  const { viewId } = props
  const { getExtensionViewById } = useContext(InsightsApiContext)

  const { data, loading } = useParallelRequests(
    useMemo(() => () => getBuiltInInsight(viewId), [viewId])
  )

  return (/* Render insight chart */)
}
So in this component we use getBuiltInInsight function from our InsightsApiContext context. If we go to InsightsApiContext
definition we will see that this is just an object with some async function collection.
All these functions and their interfaces are described in this one interface ApiService
Then if we want to write some unit test for the BuiltInInsight component we will write something like this
const mockAPI = createMockInsightAPI({
  getBuiltInInsight: () => ({ /* Some mock insight data */})
})

it('BuiltInInsight should render', () => {

  const { getByRole } = render(
    <InsightsApiContext.Provider value={mockAPI}>
      <ExtensionInsight viewId="TEST_VIEW_ID" />
    </InsightsApiContext.Provider>
  )

  /* Further test logic here */
})